- Your gateway to the Maritime Knowledge!
- [email protected]
How to correctly plot the Tropical Revolving Storm (TRS)
What is a Contract of affreightment?
July 13, 2020
How and when to ventilate the Cargo Holds?
July 23, 2020Out at sea, one thing which concerns me the most as a Master is Weather. After all, we as seafarers are always at the mercy of the weather. When the vessel is out at sea or undertaking cargo operations, a prudent ship’s officer will always keep a close watch on the weather forecast and act accordingly. In this topic, we shall understand how to carefully and correctly plot the Tropical Revolving Storm.
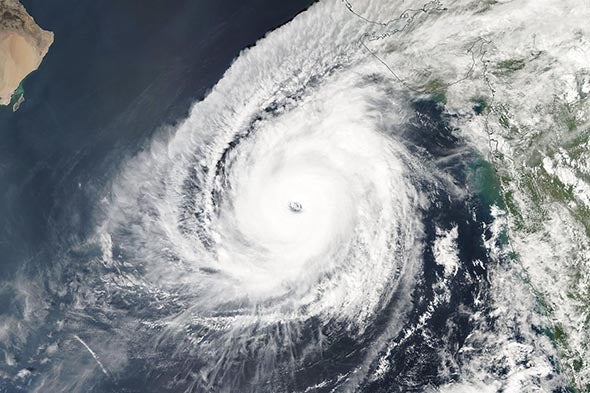
One aspect of Heavy weather encountered at sea is carefully reading, understanding and tracking an onsetting or a developing Low pressure area / Tropical Revolving Storm (TRS).
In an event of receiving such warning, the Master would ask the navigating officer to ‘plot’ the position of the Low Pressure Area / TRS on a small scale chart (usually Routeing Chart) showing both the vessel’s position and the position of the Storm.
The idea behind this is to quickly assess the position of the Storm with reference to own ship, the distance off and to determine the projected path of the storm.
Although most modern navigational bridges’ are equipped with real time weather update softwares giving position of the storm and the vessel in real time, still, the value of a plotted Storm’s position on a Routeing Chart meticulously laid down on the Chart Table cannot be undermined.
The weather reports received onboard are usually at Synoptic Hours (or at time intervals at which the Meteorological Station is transmitting). It is needless to emphasize that how much important it is to correctly plot the position and the predicted path of the storm. Since we know that path of the storm can ‘ONLY’ be ‘PREDICTED’ and is just an assumption based on certain models and respective calculations. So it is all the more important that ship’s officers’ be aware of the area in proximity to the storm, which poses an imminent danger as there is a fair chance that the TRS can take any path other than the one predicted.
Let us learn how to correctly plot the TRS on a Chart. This information is fairly important to the Junior Navigating Officers.
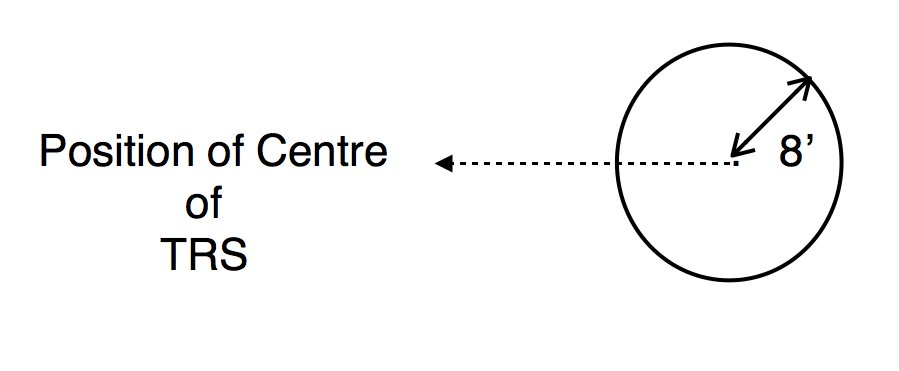
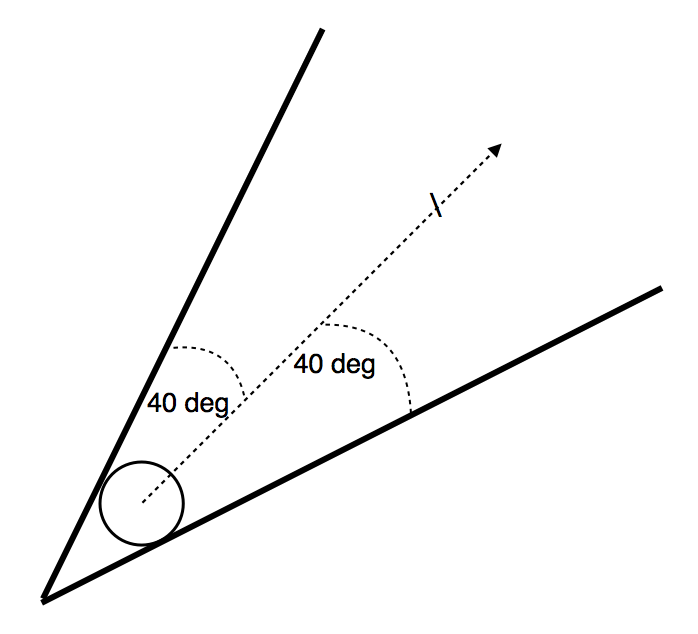
Step 1: Plot the position of the low pressure are / TRS as determined by the Weather Reports. To that position, draw a circle marking the eye of the TRS (if applicable). For eg. let us assume the eye has a radius of 8 miles.
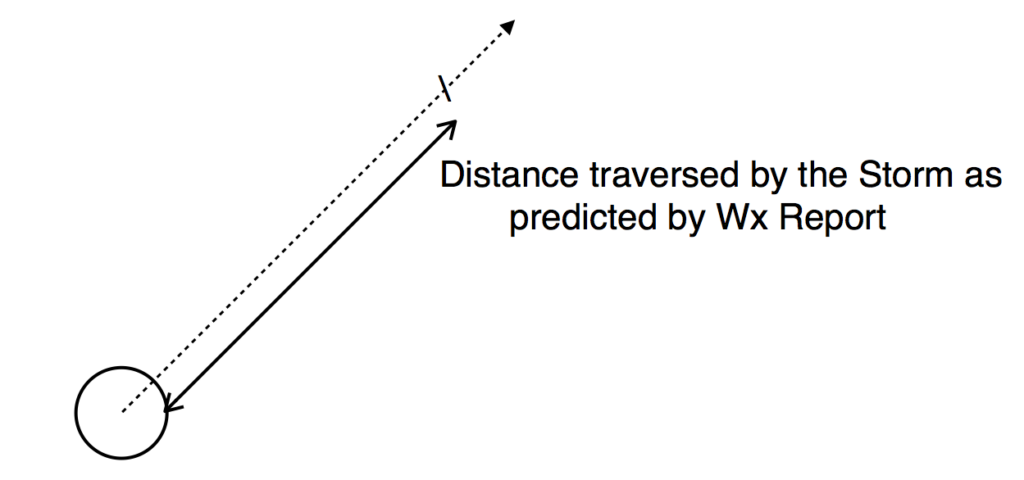
Step 2: Draw the predicted path of the Storm for the next 24 hours by calculating the distance it is likely to traverse in the next 24 hours (as per the forecast) as shown below
Step 3: From the line of the predicted path draw angle of 40 degrees to either side and connect as the tangent as shown
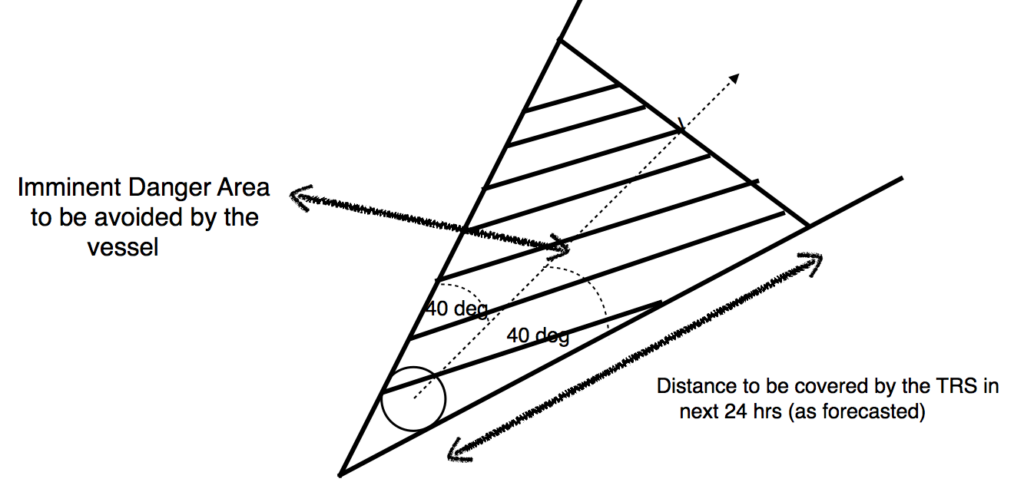
Step 4: Mark the Imminent Danger Area for the next 24 hours ( the area which the vessel needs to avoid), by passing the line through the 24-hours distance marking as shown below
So, we now know that which area poses an imminent danger for the next 24 hours keeping in mind the various probabilities of the position and the predicted path of the storm.
This area shall be avoided by the vessel at all times.
Hope you liked this topic. Do let us know your valuable comments in the comment section below.
Watch exciting videos here
Wish you fair seas and a Bonn Voyage!




2 Comments
Thanks for the weather information.
Thanks Amjad… Glad you liked it 🙂