Not able to obtain all six drafts? Here what you should do!
June 2, 2021Landfall
June 6, 2021
So so so many requests for grain loading procedures and calculations. Here we are!
Through this tutorial I will try to put an end to all the speculations and confusion regarding loading of grain onboard Bulk Carriers.
Grain, just like any other cargo has certain hazards. The perishable nature of the grain cargo adds to the care and caution which the whole process of the carriage demands. Such is the pressure for this grain loading on the mind of ship’s crew that from the time the vessel is fixed for loading grain till the time it discharges the cargo, no one attains mental peace 🙂
So, this blog is dedicated to the officers who want a clarity and understanding of the topic covering all aspects of grain loading and calculations. This blog is dedicated only to grain calculations prior loading. I will write about hold cleaning procedures and loading procedures in upcoming blogs. Let us begin!
Just like any other cargo, when grain cargo is loaded, vessel is required to comply with intact stability requirements ( only additional factor being in compliance with heeling moments). This is simply because the grain can shift during voyage and officer should ensure that heeling moments imposed by the grain cargo is kept to minimum.
Let us assume that your vessel gets the following Voyage orders for your next employment. Note that this is just an example and actual restrictions may differ at these ports.
VOYAGE INSTRUCTIONS –
Loading port : Novorossiysk , Russia [Density 1.025, No draft restrictions]
Discharging port: Phu-my , Vietnam [Density 1.000, No draft restrictions]
Cargo: Wheat in Bulk [ SF = 42.5 Cuft/tonne ]
Kindly confirm max intake of the cargo and tender the Pre-Stowage plan.
We shall proceed as per the following steps which shall be explained in detail as we move on-
Step 1. Calculate Maximum amount of cargo that can be carried safely. Ensure that you are not exceeding drafts and limits anywhere during the voyage.
Step 2. Obtain the allowable heeling moments using the grain stability booklet. Distribute the maximum loadable cargo into the holds such that maximum number of your holds are full. The amount of grain which can be loaded into a hold can be easily calculated by dividing the grain capacity of a hold by the stowage factor of grain. You can calculate this by using the loadicator also. Distribute the cargo keeping in mind the trim / drafts etc you want to achieve upon completion of loading.
Important Note: Remember, that unfilled holds means increase in the total heeling moment values of the vessel as unfilled holds adds to heeling moments as they have space in which the grain cargo can shift. Your ultimate aim is to keep the total heeling moments lesser than allowable. You normally use the loadicator to carry out the distribution however you can do this manually too. We will discuss that.
Step 3. Once we have the volume of cargo in each hold, use the Grain Heeling Moment tables given in the booklet and obtain the heeling moments generated by each hold. For the holds which are completely filled and trimmed you have to use “Heeling Moment tables for filled and trimmed holds”. For holds that are partially filled you have to obtain the Heeling moments and multiply it with 1.12. This is done to compensate the adverse affect in case the the cargo shifts “vertically” in partially filled holds.
Step 4. Convert the Volumetric heeling moment obtained for each hold into Grain heeling moment by dividing the Volumetric heeling moment by the SF of the cargo
Step 5. Compare the total heeling moments obtained with Allowable Heeling Moments. If the THM < AHM, loading is permissible otherwise you need to re distribute the cargo to reduce heeling moments
Step 6. Obtain other data from the loadicator when you have made the pre-stowage plan (in Step 2) such as angle of heel due to shift of grain shall not be greater than 12 degrees, net residual area shall not be less than 0.075 m-radians, GM should not be less than 0.30 meters, ensure that vessel complies with requirements during all stages of voyage and ship should be upright prior proceeding to the sea. Now these all figures can easily be obtained from loadicator. And if you remember these above points are the requirements of the Grain code and Intact Stability code and therefore is required to be satisfied by the vessel carrying grain.
Let’s discuss all the steps one by one!
Step 1. Calculate Maximum amount of cargo that can be carried safely. Ensure that you are not exceeding drafts and limits anywhere during the voyage.
Let us perform a deadweight calculation for the vessel. In case you need to see how to perform deadweight calculation you can watch the video series by clicking here!
Novorossiysk is in Summer Zone with no draft restrictions. Density is 1.025. Similarly Phu-my lies in the Tropical Zone and no draft restriction exists. No restrictions exists during transiting Istanbul Straits and Suez Canal. So, in this case, we can easily load up to summer draft at Novorossyisk.
Max Summer displacement = 94798 mt [Summer draft = 14.486m, Density = 1.025]
Light ship (-) = 12628 mt
Summer deadweight. = 82170 mt
(-) Heavy Fuel Oil = 1197 mt
(-) Diesel Oil = 160 mt
(-) Fresh Water = 150 mt
(-) Unpumpable Ballast = 150 mt
(-) Slop / Sewage = 20 mt
(-) Constant =. 343 mt
(-) Sag allowance = 150 mt
Max Cargo Intake = 80,000 mt
So, we can carry a maximum amount of 80000 mt of wheat till the summer draft.
Moving on to Step 2
Step 2. Obtain the allowable heeling moments using the grain stability booklet. Distribute the maximum loadable cargo into the holds such that maximum number of your holds are full. The amount of grain which can be loaded into a hold can be easily calculated by dividing the grain capacity of a hold by the stowage factor of grain. You can calculate this by using the loadicator also. Distribute the cargo keeping in mind the trim / drafts etc you want to achieve upon completion of loading.
I will now use the loadicator program to double-check that I can carry this much cargo and try to distribute the cargo by filling maximum number of holds to 100% . Let us assume that as per the loadicator I can easily carry 80,000 mt of cargo with 1 meter of trim by stern (required as i want to reach discharge port at even keel. Therefore, my planned sailing drafts at loading port would be
Forward : 13.986 mtrs Midship: 14.486 mtrs Aft: 14.986 mtrs
Also, through the loadicator I have obtained that my displacement would be 94798 mt (summer displacement) and corresponding KG (corrected for FSM) is 10.96 meters. So using this data let us calculate the allowable heeling moments corresponding to this displacement, corrected KG and trim of 1 meter. This can be calculated using the grain stability booklet under section “allowable heeling moments” as shown –
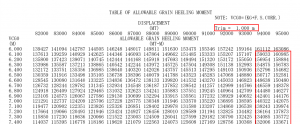
Extracting the data from the table is easy. VCG or KG (corrected for Free Surface Correction) is used to enter the table from the left to right and displacement is used to enter from top to bottom. I have marked the values to be taken into consideration for carrying out interpolation.
As per the calculation ;
for displacement : 94798 mt
KG : 10.96 mtrs
Trim : 1 mtrs
ALLOWABLE HEELING MOMENTS : 58694 mt-m
Now, let us have a look at ship’s particulars and obtain the grain capacity of all cargo holds as follows –
Cargo hold Grain Capacity (including hatches)
Cargo hold no 1 : 14107 m3
Cargo hold no 2 : 15397 m3
Cargo hold no 3 : 13741 m3
Cargo hold no 4 : 13143 m3
Cargo hold no 5 : 13740 m3
Cargo hold no 6 : 15394 m3
Cargo hold no 7 : 12854 m3
Looking at above we can say that the #2 and #6 has the maximum capacity, followed by #1, followed by #3 , and then #4 and finally #7.
Remember that the cargo hold with maximum capacity will generate maximum heeling moments when left partially filled. Therefore, it is important to fill up those cargo holds to 100% which have higher capacities. Let us use loadicator to do that.
But first convert SF 42 Cuf/LT into m3/t as follows –
dividing by 35.8814 (SF conversion factor) SF = 1.17054 m3/t
So, after using the loadicator, i came to following distribution of cargo –
Cargo Hold Weight loaded Volume filled % filled Status
Cargo hold no 1 : 12052 mt 14107 m3 100 filled and trimmed
Cargo hold no 2 : 13154 mt 15397 m3 100. filled and trimmed
Cargo hold no 3 : 7696 mt 9008 m3 66 unfilled & trimmed
Cargo hold no 4 : 11228 mt 13143 m3 100 filled and trimmed
Cargo hold no 5 : 11738 mt 13740 m3 100 filled and trimmed
Cargo hold no 6 : 13151 mt. 15394 m3 100 filled and trimmed
Cargo hold no 7 : 10981 mt 12854 m3 100 filled and trimmed
Total cargo loaded. : 80000 mt
This can also be calculated manually as described above by dividing the Grain capacity of the cargo hold by SF.
For cargo hold no 1 it will be 14107/1.17054 = 12051.7 or 12052
Similarly you can calculate for other holds as well.
Step 3. Once we have the volume of cargo in each hold, use the Grain Heeling Moment tables given in the booklet and obtain the heeling moments generated by each hold. For the holds which are completely filled and trimmed you have to use “Heeling Moment tables for filled and trimmed holds”. For holds that are partially filled you have to obtain the Heeling moments and multiply it with 1.12. This is done to compensate the adverse affect in case the the cargo shifts “vertically” in partially filled holds.
Let us observe the Grain heeling moments table-
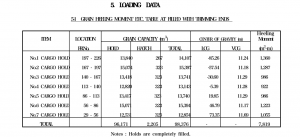
Using the above table you can easily obtain the Heeling moments for holds which are 100 percent filled and trimmed ( All hold EXCEPT cargo hold no 3 in this case ).
So let us fill up the details as we know from the last column of the above table, except for number 3 which we will calculate from another table.
Cargo Hold Weight Volume % fill Vol Heeling
Moments
Hold no 1 : 12052 mt 14107 m3 100 1360
Hold no 2 : 13154 mt 15397 m3 100 1287
Hold no 3 : 7696 mt 9008 m3 66 ????
Hold no 4 : 11228 mt 13143 m3 100 922
Hold no 5 : 11738 mt 13740 m3 100 986
Hold no 6 : 13151 mt. 15394 m3 100 1223
Hold no 7 : 10981 mt 12854 m3 100 1055
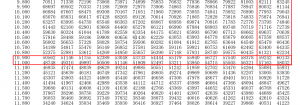
Let us obtain the data for Hold no 3 from the table given in the Grain Stability Booklet –
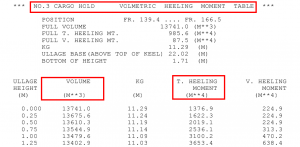
So, this table is given for each hold individually and shows that how much heeling moment will be generated by a certain volume of grain cargo in a certain hold.
Moving down in the same table we have –
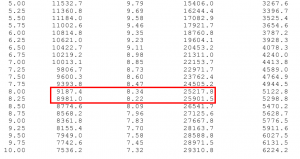
So, now we have to interpolate the heeling moment value for 9008 m3. After interpolating –
We get Heeling Moment as 25812. But since Hold no 3 is partially loaded we need to multiply this figure with 1.12 in order to compensate the moments for any vertical shift.
Therefore, 25812 x 1.12 = 28909
Let us complete the table –
Cargo Hold Weight Volume % fill Vol Heeling
Moments
Hold no 1 : 12052 mt 14107 m3 100 1360
Hold no 2 : 13154 mt 15397 m3 100 1287
Hold no 3 : 7696 mt 9008 m3 66 28909
Hold no 4 : 11228 mt 13143 m3 100 922
Hold no 5 : 11738 mt 13740 m3 100 986
Hold no 6 : 13151 mt. 15394 m3 100 1223
Hold no 7 : 10981 mt 12854 m3 100 1055
Step 4. Convert the Volumetric heeling moment obtained for each hold into Grain heeling moment by dividing the Volumetric heeling moment by the SF of the cargo
Carrying out the above we obtain;
Cargo Hold Weight Volume % fill Vol Heeling. Grain Heeling Moment
Moments
Hold no 1 : 12052 mt 14107 m3 100 1360 1162
Hold no 2 : 13154 mt 15397 m3 100 1287. 1100
Hold no 3 : 7696 mt 9008 m3 66 28909 24698
Hold no 4 : 11228 mt 13143 m3 100 922 788
Hold no 5 : 11738 mt 13740 m3 100 986 842
Hold no 6 : 13151 mt. 15394 m3 100 1223 1045
Hold no 7 : 10981 mt 12854 m3 100 1055 901
Total Cargo : 80000 mt Total Heeling Moment : 30536
Step 5. Compare the total heeling moments obtained with Allowable Heeling Moments. If the THM < AHM, loading is permissible otherwise you need to re distribute the cargo to reduce heeling moments
In this case clearly the Total Heeling moment (30536) is less than the Allowable Heeling Moment (58694) therefore condition is permissible.
Let’s continue…
Step 6. Obtain other data from the loadicator when you have made the pre-stowage plan (in Step 2) such as angle of heel due to shift of grain shall not be greater than 12 degrees, net residual area shall not be less than 0.075 m-radians, GM should not be less than 0.30 meters, ensure that vessel complies with requirements during all stages of voyage and ship should be upright prior proceeding to the sea. Now these all figures can easily be obtained from loadicator. And if you remember these above points are the requirements of the Grain code and Intact Stability code and therefore is required to be satisfied by the vessel carrying grain.
This is a very simple step where you have to check the loading conditions during all stages of voyage using the loadicator. If the intact stability criteria is not complied with – the loadicator shows an alarm in red (Working with loadicator has already been shown in previous videos. Watch them here )
So, I will not be discussing using loadictor separately for this as it will make the topic too lengthy. However, just note that whatever we did manually above, loadicator does that automatically including giving heeling moments. What’s more is that you have the option of optimizing each hold as filled, partially filled , trimmed or untrimmed and accordingly it will calculate the moments and gives the heeling moments and other stability values. So, values of angle of heel due to shift of grain, net residual area and a ready made GZ curve etc is readily available in loadicator.
The drawing of GZ Curve, calculating the net-residual area etc. is normally not done on a vessel by any officer. This is only limited to academics taught in classes. Instead, loadicator is used to obtain the required data. Loadicator is an approved instrument and is used to determine values and calculate stability. However, the grain stability booklet do show the procedure of drawing the GZ Curve manually. If your are enthusiastic in learning about it you can always practice it using the cross curves of stability. Alternatively, you can learn here. A point to remember, is that different Stability booklets may have a different way of data presentation. Hence, officers shall be well versed with the stability booklets.
Click here to read Part II which focuses on pre-loading preparations.
Do send in your comments or other queries in case you have any!
Wishing you fair seas and Bonn Voyage!
Follow us on –


2 Comments
[…] Read about the grain loading here […]
[…] continuation with our discussions in Part I for this topic let us discuss regarding all pre-loading checks and preparations supposed to be […]